Debugging Gen III Pokémon Games
I’d like to quickly share my setup for debugging Gen III Pokémon games. This setup has helped me both understand how undocumented parts of the games work and also create the mods on this site. Hopefully sharing this helps others looking to do the same.
This setup is compatible with the pokeruby, pokefirered, and pokeemerald projects on Linux, MacOS, or WSL.
VSCode
VSCode offers a great interface for debugging code. The experience is streamlined into the code editor and uses the source code to provide useful context while debugging. Let me explain with a few examples.
Setting breakpoints
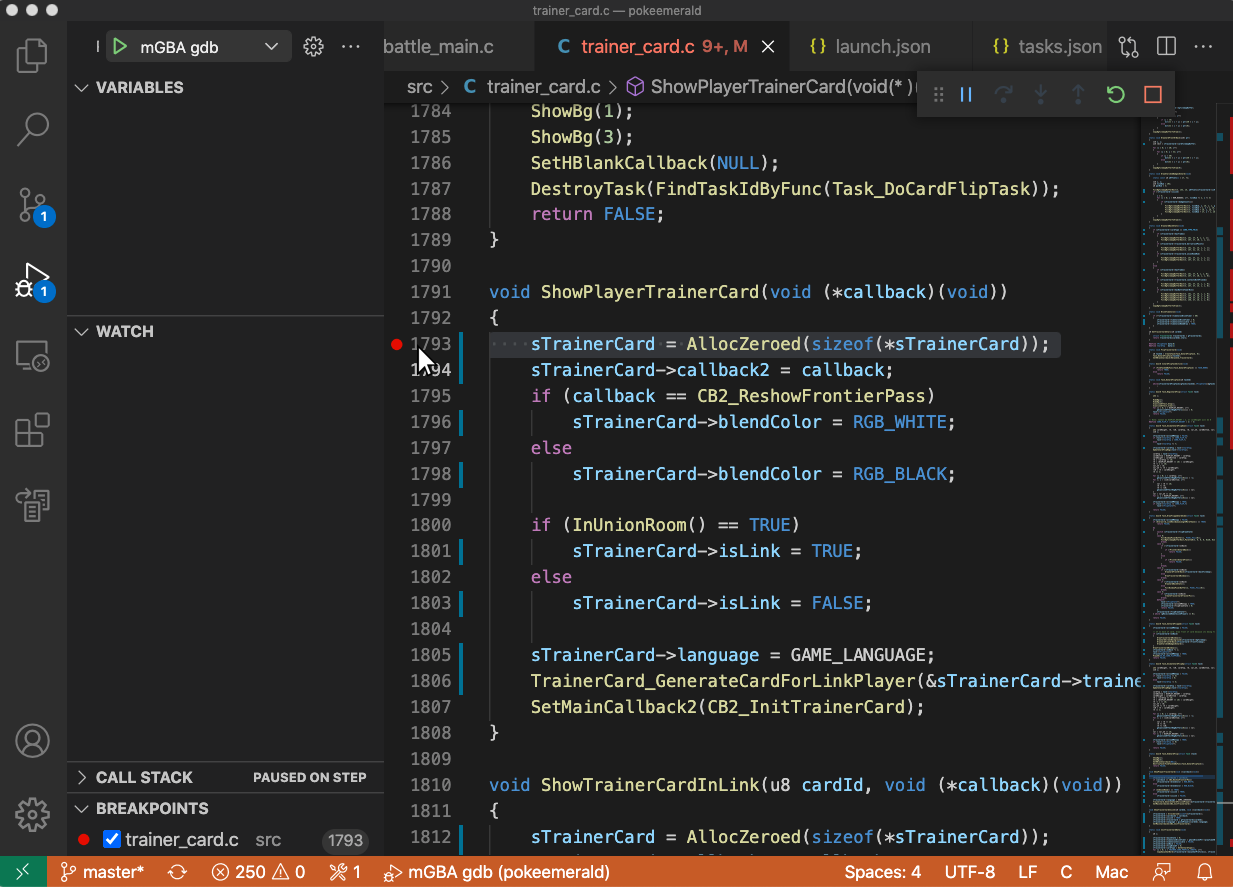
You can set a breakpoint at a particular line of code. When that line is executed, the progam pauses, allowing you to inspect program state (such as RAM variables and the call stack). You can then follow the program as it executes line-by-line.
This action is highly streamlined in VSCode – you simply click next to a line of code to add a breakpoint:

Watching global variables
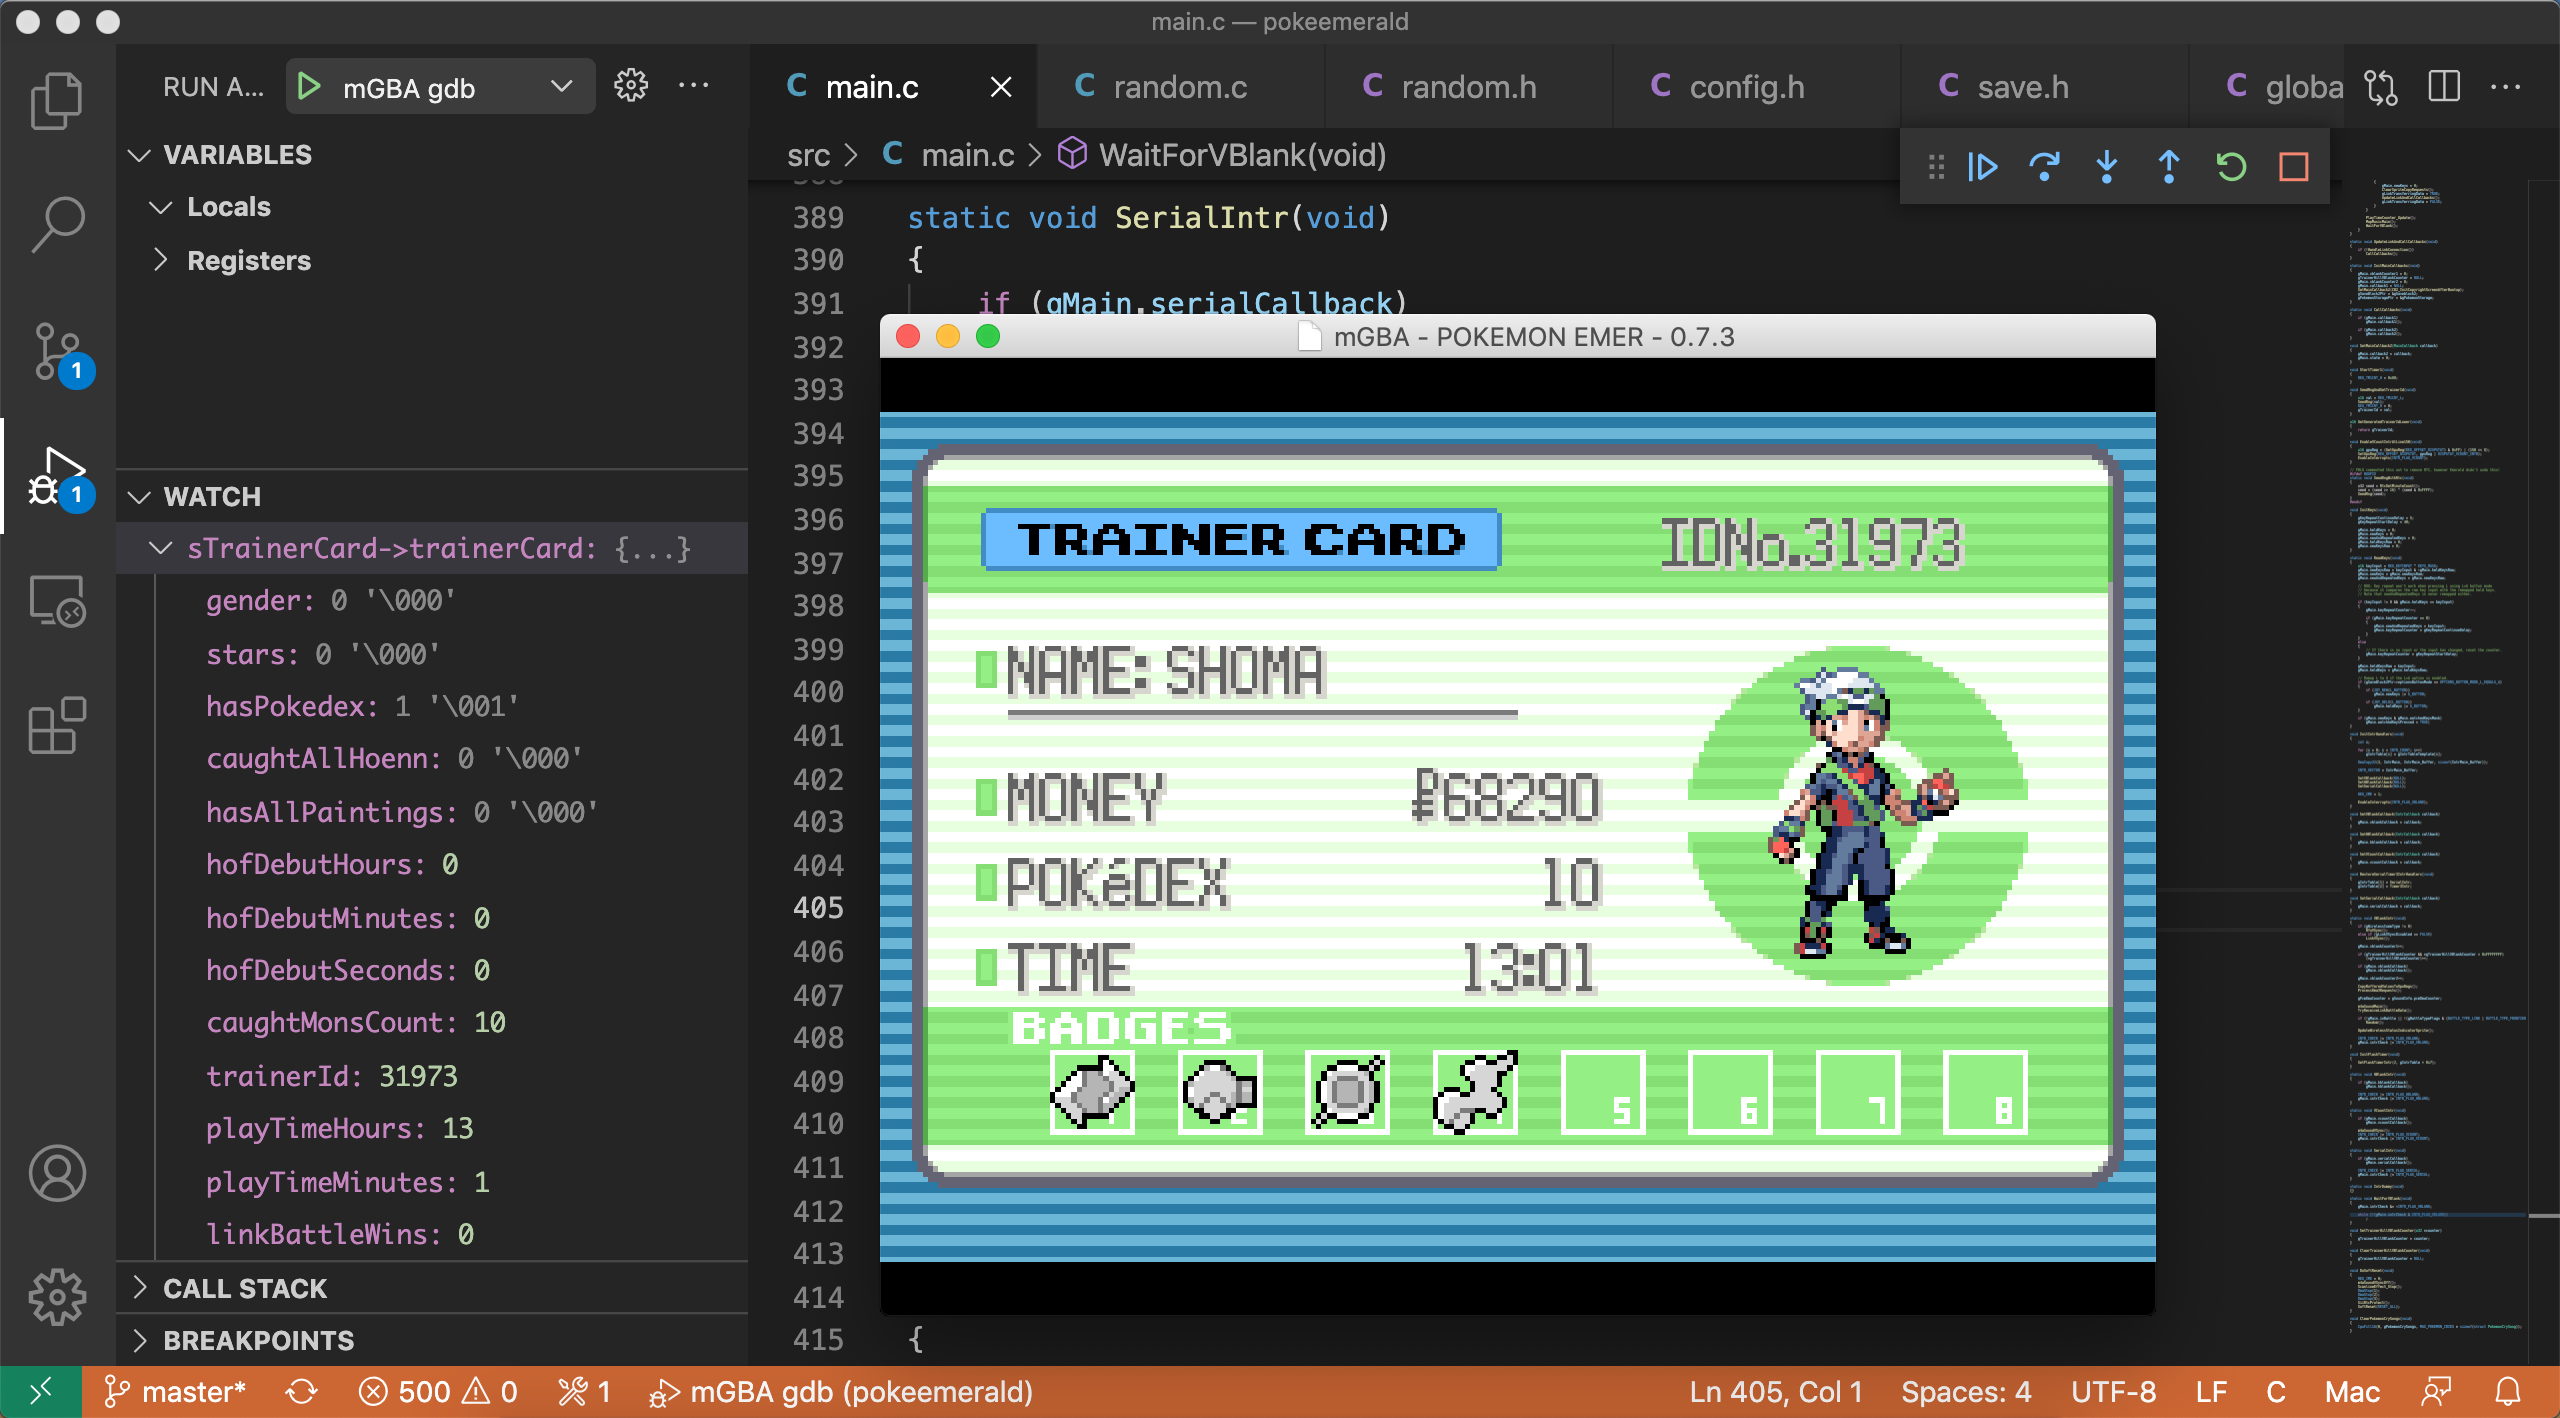
The Gen III Pokémon games use many global variables. VSCode allows you to watch these variables – when the program is paused, you can see their current values. The interface interprets and displays C data types, allowing you to easily explore how structs and arrays defined in the source code are used.
For example, we can watch the internal representation of a trainer card sTrainerCard->trainerCard. When the game is paused, we see its value which includes the trainer ID, Pokédex count, and play time:

Setting watchpoints
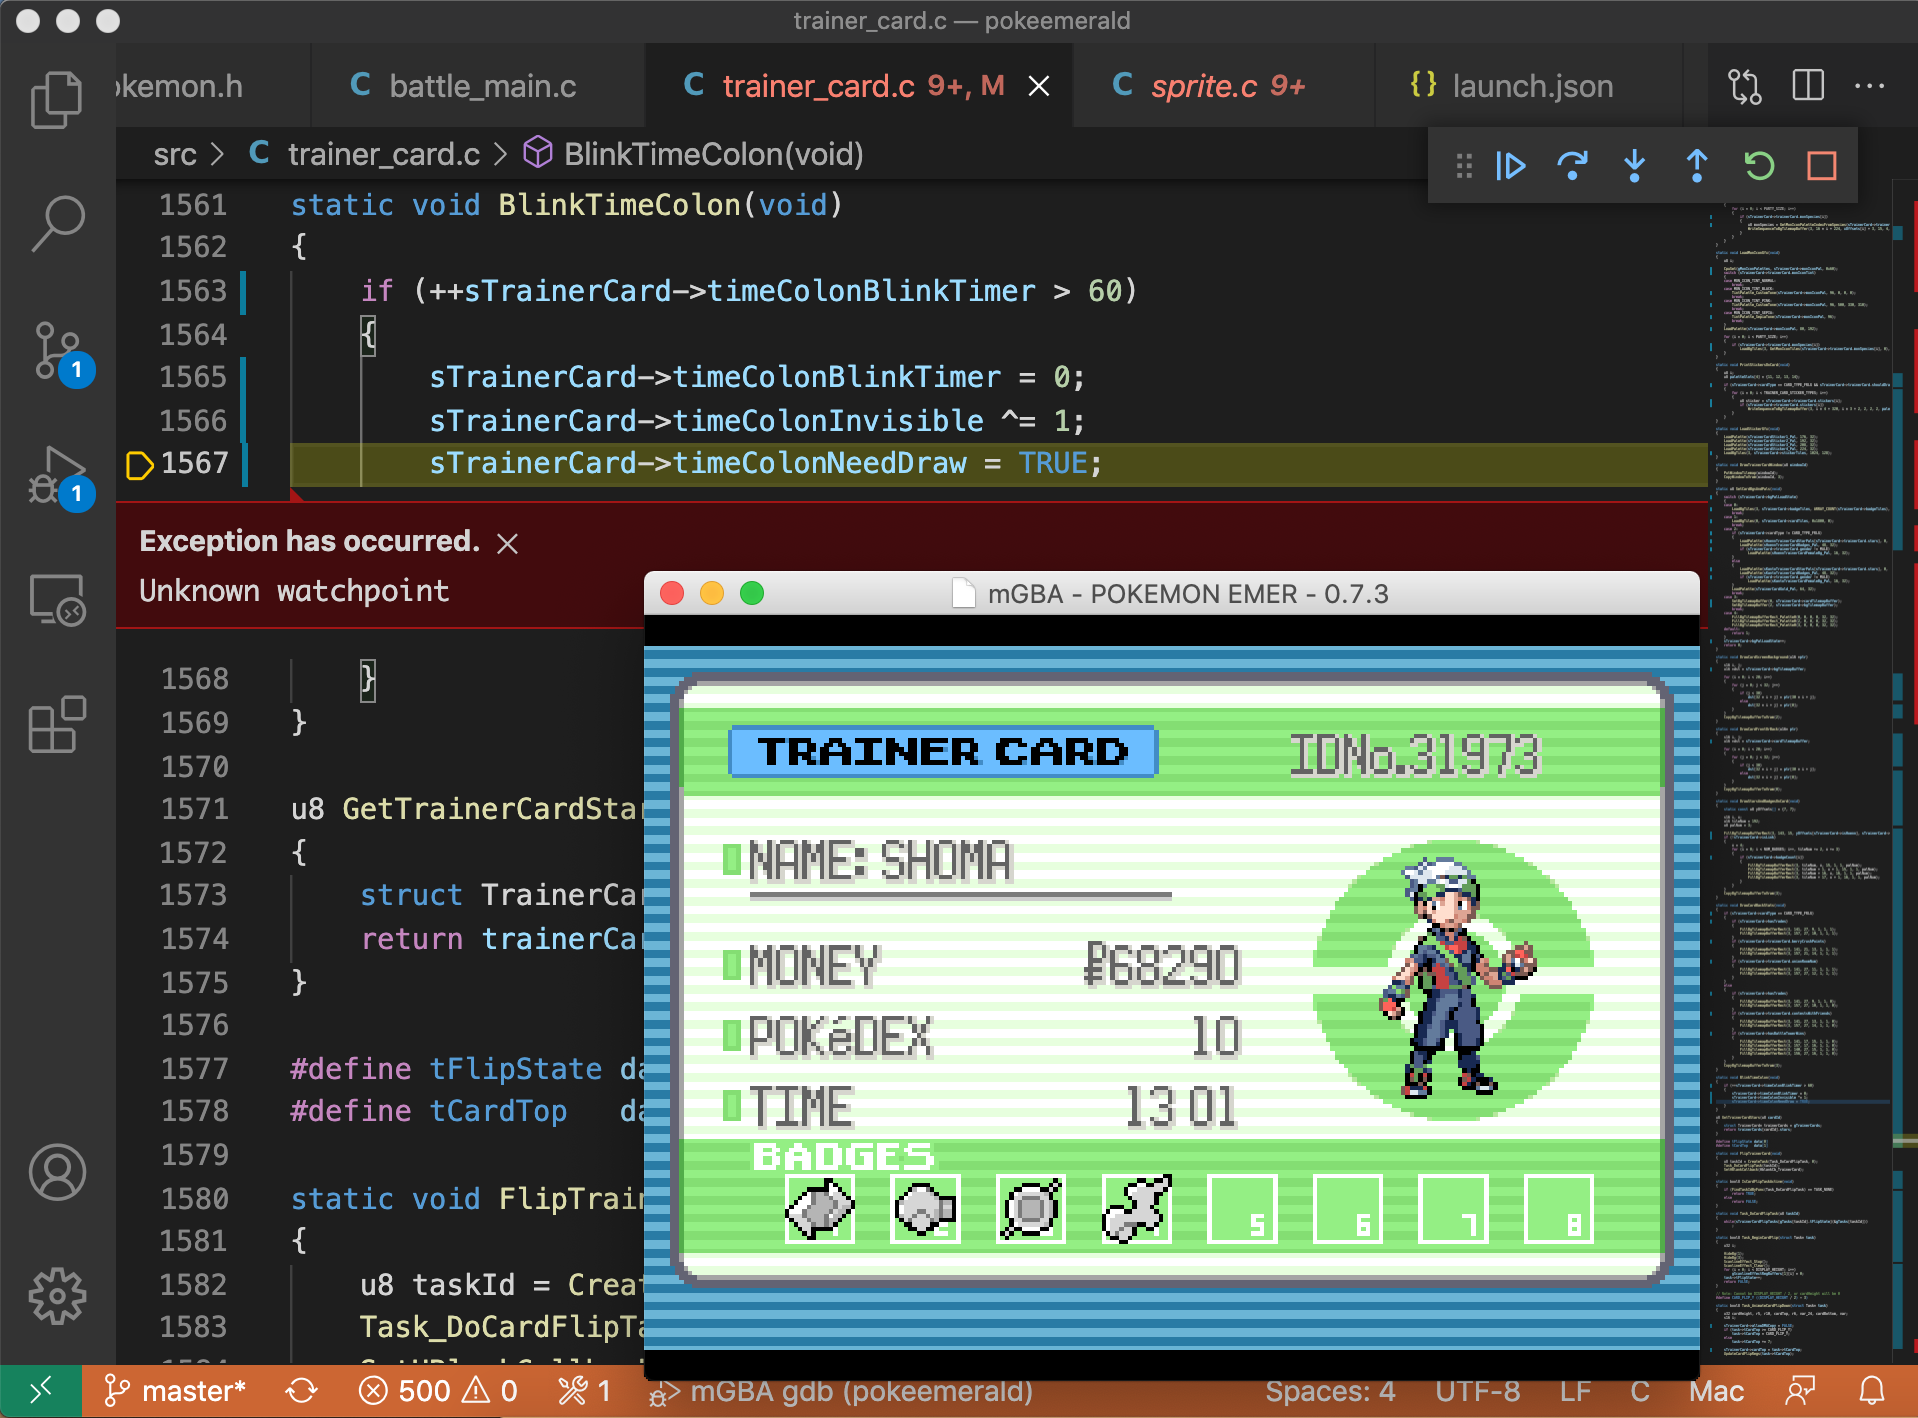
Sometimes a global variable changes, and you’d like to figure out exactly when it happened. In VSCode, you can set a watchpoint on a global variable. When the value of the variable changes, VSCode pauses the program and shows you the line of code that made the change.
For example, the colon in the trainer card’s play time ticks every second. To find out which line causes this, we set a watchpoint in VSCode’s debug console:
| |
Then the game will pause after the value of sTrainerCard->timeColonInvisible changes. Here we see line 1566 caused the change:

Setup
In addition to VSCode, this setup requires the mGBA emulator, and devkitPro. mGBA comes with a gdb server, which VSCode can hook into to issue debugging commands.
In VSCode, you can configure your debugging setup in the .vscode/launch.json file of your project. We specify a launch configuration which boots up mGBA and the debugging server. The configuration contains a preLaunchTask defined in .vscode/tasks.json, which builds the game with debug symbols, loads it into mGBA, and starts the server.
Notes
In order to use this setup on WSL, the project folder must be located in the WSL file system.
It is worth noting that because these games are compiled at the -O2 optimization level, some variables and lines of code are optimized out of the game. If needed, you can recover these by inserting calls to dummy functions.
Special thanks to Sierraffinity for first documenting this workflow.